User Retention: A Practical Guide to Boost Loyalty and Revenue
What is user retention? Why is this metric crucial for product marketing? What user retention strategies help it grow? What formulas count it? And why are these all about pirates?


What Is User Retention, and Why Does It Matter?
User retention measures whether people return to your platform and shows how you keep your audience engaged over a specific time frame. Unlike marketing or traffic metrics, retention is about the product: users come back only if they find real value and feel their expectations are exceeded. In many ways, retention tests the product’s success, reflecting all sides and stages of its usage: from the user journey to the payment process.
For subscription-based products, user retention is often tracked monthly, quarterly, and yearly, but the 3rd and 30th day retention rates are especially revealing. These early milestones show if users are forming a habit with your product or drifting away after a brief encounter. Retention is measured as a percentage, known as the user retention rate.
A Bain and Company report finds that a 5% increase in customer retention produces more than a 25% increase in revenue.
User Retention vs. Churn
Churn rate is simply the opposite of user retention. While retention shows how many users return to the platform or product, churn shows how many do not return or renew their subscription.
Churn rate is usually measured monthly, quarterly, or annually, depending on the type of service or product. Most companies use an annual churn rate by default, but businesses with monthly models, such as video streaming platforms, mobile or internet providers, or SaaS services, also consider the monthly rate important, according to Harvard Business Review.
Churn rate is easy to calculate: take the total number of customers who left your product or services during the period and divide by the total number of customers at the beginning of this period.
User Retention vs. Customer Retention
The difference is subtle but crucial for some businesses. User retention shows individual engagement with the platform, service, product, or other actions, while customer retention covers only business-related actions, if they differ. For example, on an OTT platform, user retention means a user opens the platform, while customer retention means they renew their subscription, rent, or buy a film. The platform can have high user retention but poor customer retention, or the opposite: fewer users retained, but all are paying customers.
Retention vs Engagement
With these two, it is not about competition or huge differences, but about partnership—both are needed to be measured if your digital business is successful. As we continue to repeat, retention is about users coming back to use your product or service; engagement indicates how deeply they interact with it. Engagement is rarely a standalone metric, but there are various metrics to measure it: session length, features used, actions completed (likes, shares, comments), content creation metrics, etc. Often, retention is used as an engagement metric because it indicates if users are interested in usage, because if they are not, you won’t retain them.
Industrial Framework to Analyse Retention
Retention as a part of AARRR
In 2007, Dave McClure presented his talk Product Marketing Metrics for Pirates, where he described user retention as of Rs, where all letters mean Acquisition, Activation, Retention, Referral, Revenue. So you can see this as phases of a successful digital business circle. Of course, McLure's advice on how to retain users is pretty outdated today. While the scheme itself is still relevant, the circle of working with a customer hasn’t changed over time, and even with AI models, we still can change just the tools to acquire users, activate and retain them. We still cannot skip any of these steps.
Three main phases of retention
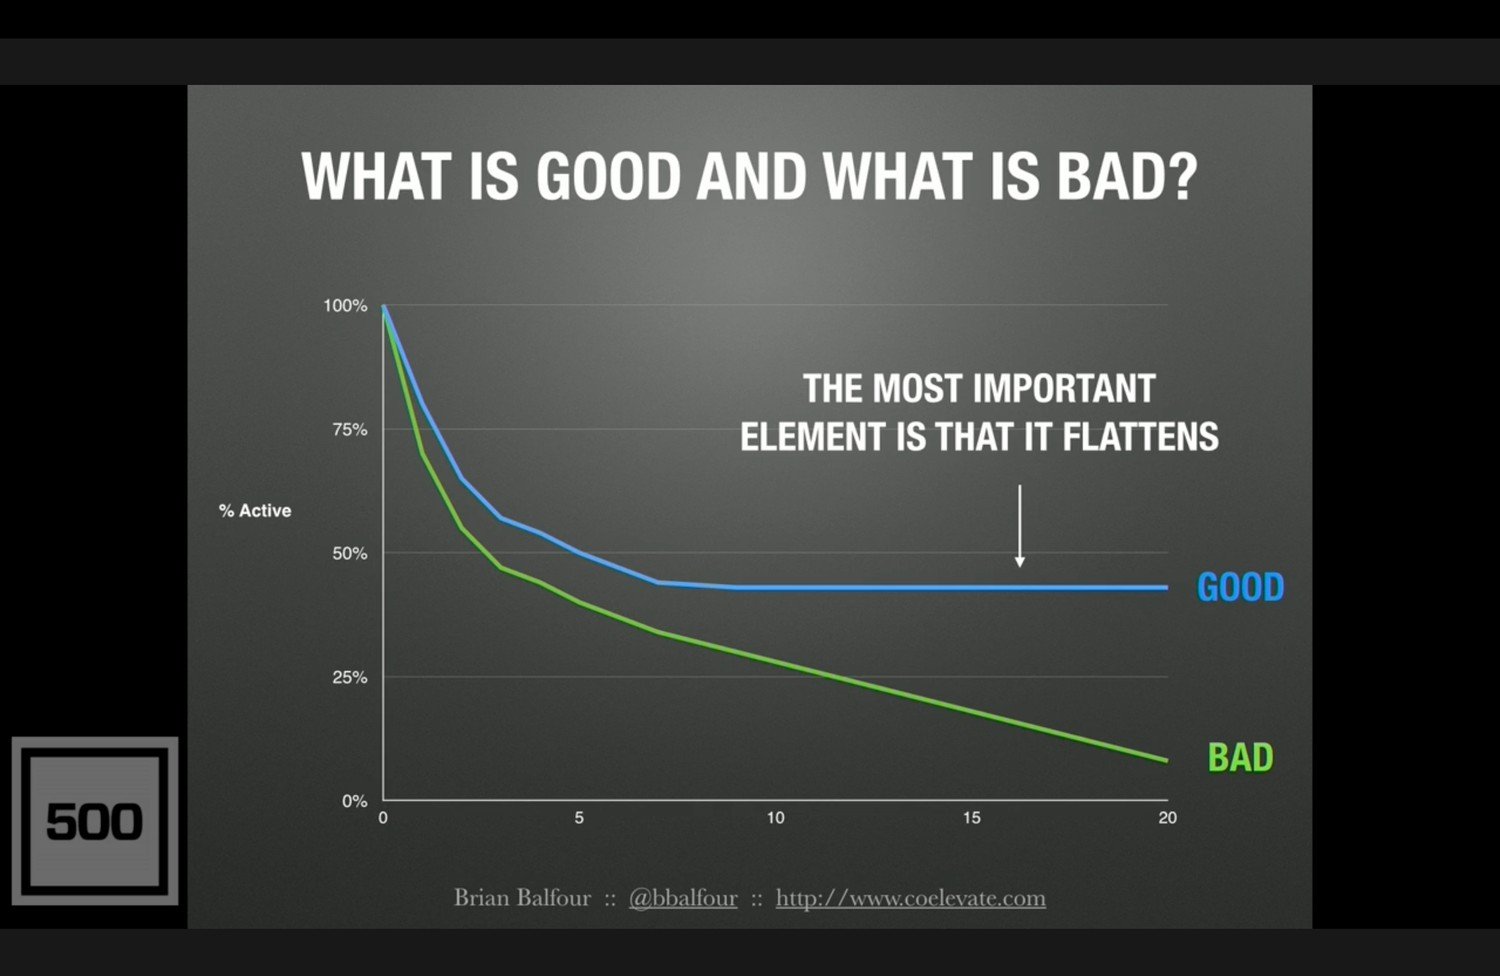
In 2015, Brian Balfour, founder and director of Reforge, at that time, VP Growth at HubSpot, presented a talk “Why Retention is King of Growth Strategy” at the Weapons of Mass Distribution (WMD) conference. Then, after leaving HubSpot, he continued to develop these theses for SideKick.
During the presentation, he introduced three lifecycle stages of retention:
Phase 1: Week One Retention (also called Day One or Month One, depending on the product). It starts when users understand the core value of the product, often called the “aha-moment.” It is important to showcase this value to users as quickly as possible. Balfour shared the example of “7 friends and 10 days on Facebook.”
Phase 2: Mid-term Retention. This phase is about building habits around the core value, when user behaviour starts to include returning to it repeatedly.
Phase 3: Long-term Retention. The job is never done; you need to ensure users experience your core value repeatedly. For example, users may subscribe to Netflix to watch Stranger Things, but Netflix must release new high-quality content to retain them after they finish the initial series.
These ideas about the three stages spread across the industry and are still used by digital agencies.
What Do We Need to Watch to Understand User Retention
The Basic Retention Rate Formula
The retention formula, provided by WallStreatPrep:
Retention Rate (%)= (Customers at End of Period−New Customers)/ Customers at Start of Period ×100
Customers at Start of Period means the number of your existing users at the beginning
New Customers means the number of users who joined during the period
Customers at End of Period means the number of users remaining at the end
As an example:
Start of month: 1,000 users
New users during the month: 200
End of month: 1,050 users
We get Retention Rate=(1,050−200)/1,000×100=85%
This formula is considered a standard one across SaaS, subscription, and cohort-based businesses, but variants exist (daily/weekly cohort retention, logo vs revenue retention).
Cohorts and Retention Curves
A cohort is a group of users who share a common experience in a specific timeframe, usually based on when they first engaged with a product or service. This distinction lets you track each cohort separately instead of analysing all users together. It helps reveal clear patterns and measure user retention precisely. For example, a cohort might include all users who signed up in January, so you can see how many return on Day 1, Day 7, Day 30, and so on.
A graph used to visualise retention for a cohort is called a retention curve. The X axis shows time since the cohort started, and the Y axis shows the percentage of users still active from the cohort. Product teams often compare multiple cohorts to understand changes in behaviour over time or after product changes.
What Is a “Good” User Retention Rate?
Mentions about Brian Balfour showed what good and bad retention curves look like. Actually, all retention curves have this hook, and you need to keep it as straight as possible for the longest possible time.
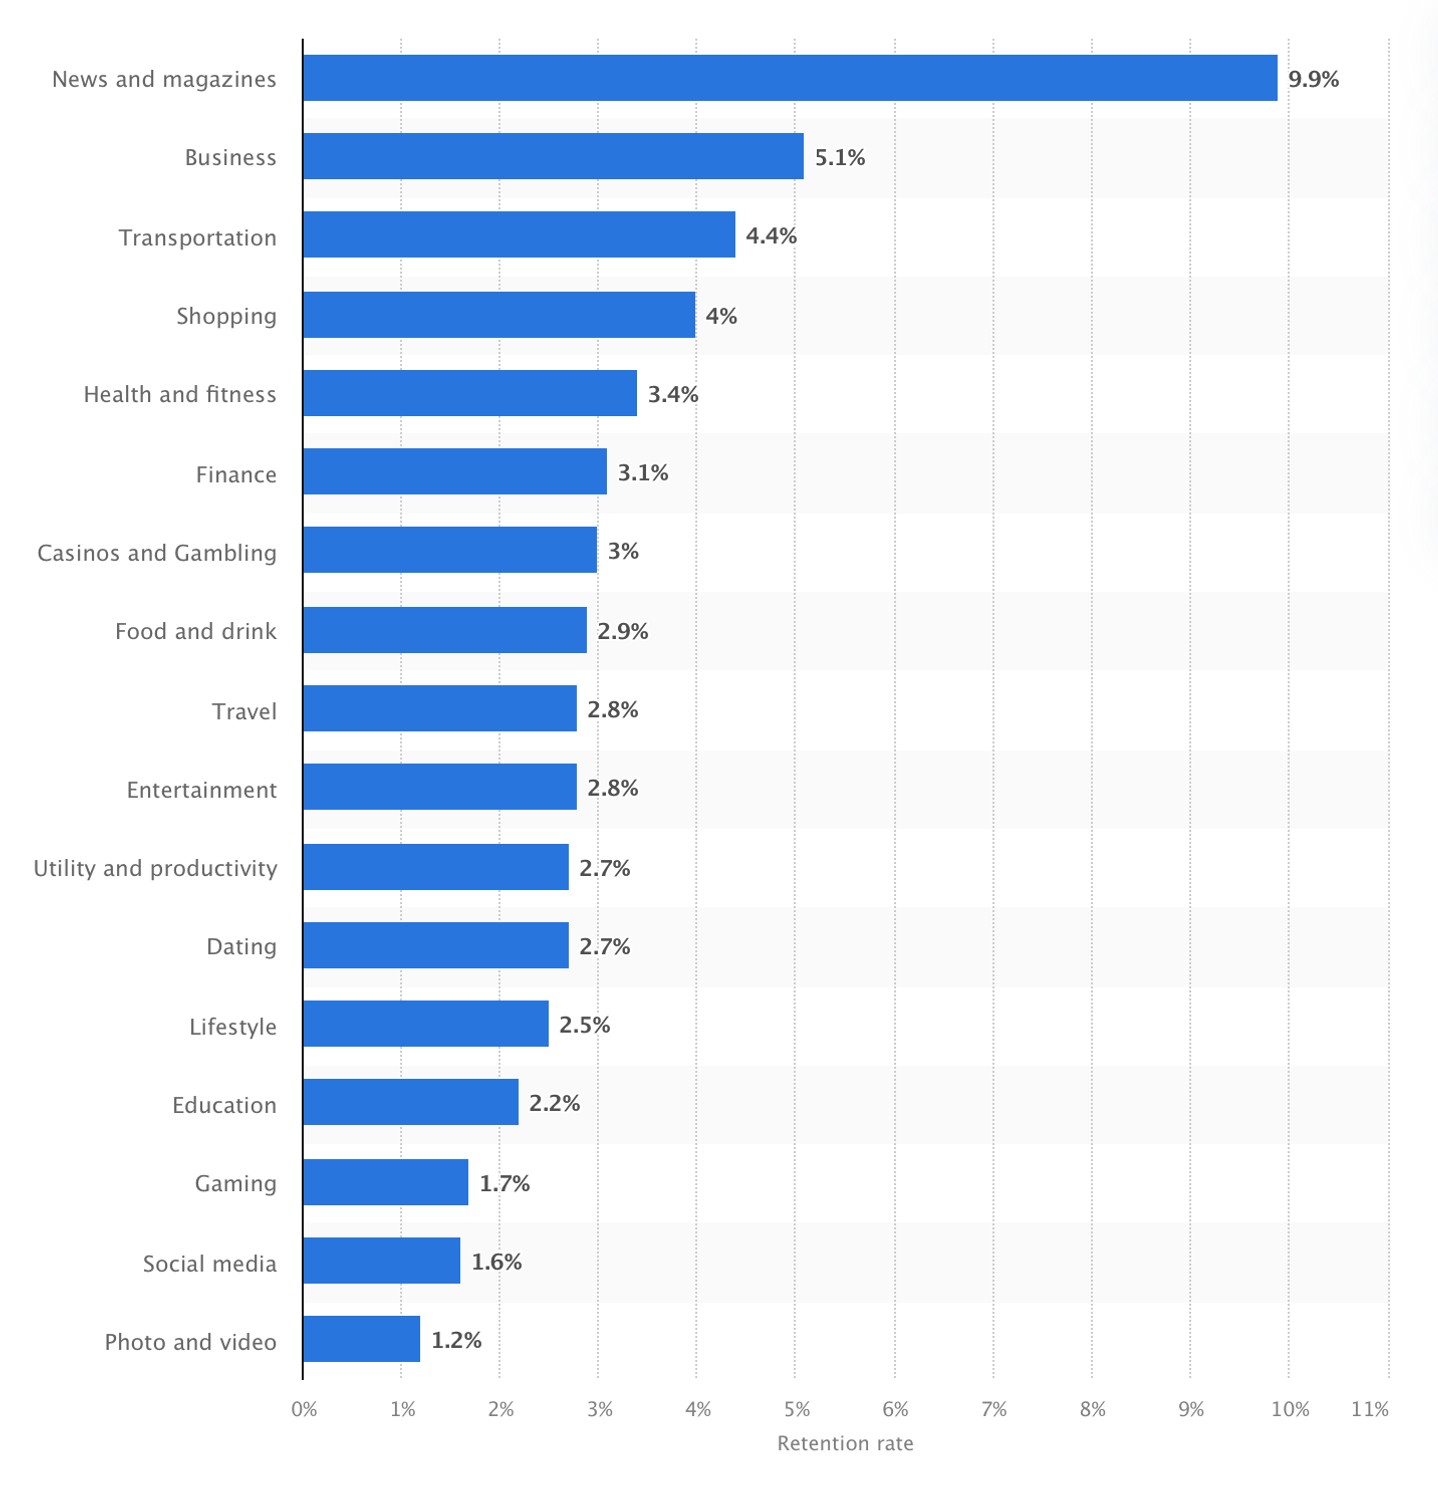
Its benchmarks differ across industries and product types. Statista shares 30-day user retention rate benchmarks for several kinds of them:
Practical User Retention Strategies
Core Features
You achieve good retention from the start if you showcase your core value to the audience, change their habits, and help them build a new one to apply this value regularly. The first strategy is to make your core feature valuable and clear, and showcase this value transparently and directly, initially through onboarding. To maintain good retention, develop this feature and add new ones, but avoid making the product more complicated. New features should be as recognisable and clear to your users as the old ones.
Virality
Another effective way to increase retention is to build virality into the core usage of the product. When a product is used repeatedly and delivers clear value, sharing often becomes a natural by-product. Dropbox is a classic example: if you use it frequently to store or send files, you almost inevitably share a link with someone else. That shared link attracts users who are already primed to use the product immediately, not just browse it.
Not every product has an obvious or necessary sharing moment built in. However, when virality exists, it serves two purposes at once: it helps acquire new users, and it re-engages existing ones. Sharing reminds current users of the product’s value at exactly the moment they are using it, sometimes even pulling them back just as they might be drifting away.
If your product does not have an obvious sharing mechanism, decide what the user creates, completes, or achieves that could be shared meaningfully. Virality does not have to be forced, but it should align with real user behaviour.
Shared Values
How will you show users that you share the same ideas? Of course, it can be part of your design, UX, and content, but it’s an implicit way. How to showcase it more explicitly? How to come into the conversation with users?
When you have a place to communicate with users and convey the company’s ideas, the easiest part becomes sharing these ideas and having a dialogue. You can tell users what you think about, or show it through special tools, or just tone of voice. Sometimes, it’s possible to show ideas even through restrictions. So, if you have conversation tools on your app or website, you can, for example, restrict them from being intolerant or rude, so users will understand that their comfort is crucial. As users grasp and align with your principles, it fosters a sense of resonance, allowing them to establish a connection and feel connected.
Analyse Feedback
Often, people share tremendous ideas on how to improve your service, and your job is to catch them. Remember that sometimes direct interviews can give you less helpful and less honest feedback than just casual conversations between two users about your product. Sometimes, people face an unpleasant experience, but hold off on writing or calling support; their loyalty decreases, and they churn. How can it be prevented? If users have tools to communicate with each other, they can share their experiences—stunning or awful—right on your service.
Also, it is not just about the support department, but the analytical one as well: everything your users share is considered as zero or first-party data. Analyse it through sentimental or semantic analysis, find user insights and improve your service constantly, based not on just hypotheses, but on concrete pains and desires of your users.
Communities Are Sticky
In Amplitude’s blog, in the article “The What, When, and Why of User Retention,” we see a theoretical example of how communities retain users: users who join at least one community on the platform are retained better. In it, it specifically says that “only 28% of the users who joined communities churned out by Day 3.”
Why is it so? People tend to unite; communities are not about the brand, but about people’s relationships. If your product isn’t the one and only, users will always compare alternatives based on quality and price. But when your service offers not only what users pay for, but also access to other people's support and recognition, it becomes harder to replace. That social value differentiates your service more than even the best logo or convenient UX.
In that sense, a community acts like glue: it strengthens retention first, and then gives you a foundation to expand what users can get from the product once engagement is stable.
Let Them Be a Part of the Service
Encourage users to engage with your service beyond just functional moments. If your product is only useful for quick, task-based interactions, it struggles to become part of a daily routine. Successful services create spaces where users can interact and return without a specific goal. Discord is a strong example: users don’t just open it to send a message: they hang out in servers, read conversations, and participate in communities. Productivity tools share this approach as well. Notion keeps users coming back by letting them build personal spaces: dashboards, notes, and shared workspaces that feel owned rather than temporary. Figma encourages habitual use through collaboration, comments, and shared files that invite ongoing participation. SoundCloud and Spotify have started to use in-app messaging to contribute to service creation, including playlists and many more.
Prizes and Achievements
Integrating gamification elements, like rewards, badges, and progress tracking, makes the UX more engaging and enjoyable. Users are naturally motivated by competitions, and such mechanics give them clear reasons to return.
Many successful services use this approach. Mentioned above, Strava uses badges, challenges, and leaderboards to motivate users to keep training and grow mobile app retention. GitHub gamifies contributions by visualising activity through graphs, encouraging developers to participate consistently.
Gamification helps turn usage into a habit, which is crucial for long-term retention. A user might open an app daily just to check their badge or confirm a streak. Over time, this repeated behaviour becomes automatic: opening the app daily feels natural, becoming users’ everyday routines.
Build Retention-Oriented Platform
Communities, virality, and gamification can be built on almost any digital platform, and the question is how to make them: in-house or by using third-party tools. In Watchers, we provide social tools that can be integrated into any service quickly and smoothly, and help you grow retention sufficiently from the first day. Book a call with the Watchers product team, and we will help you develop long-term user and customer retention with the strategy that is most suitable for your industry.
FAQs About User Retention
What is the meaning of user retention?
User retention is the ability of a product or service to keep users coming back over time. It measures how many users continue to use a product after their first interaction.
How to increase user retention?
You can boost user retention by clearly delivering core value, improving onboarding, building habits through engagement (e.g. gamification or communities), and continuously improving the product, keeping it clear and transparent.
What does 80% retention rate mean?
An 80% retention rate means that 80 out of every 100 users continue using the product over a given period, while 20% stop using it (it is called churn rate).
References
- Prescription for cutting costs | Bain and Company
- The Value of Keeping the Right Customers | Harvard Business Review
- Scales and sales: What is user engagement and why does it matter | Watchers Blog
- Retention rate on day 30 of mobile Android app installs worldwide in 3rd quarter 2024, by category | Statista
- The What, When, and Why of User Retention | Amplituda Blog
- Assessing User Retention of a Mobile App: Survival Analysis | JMIR Publications
- Startup Metrics for Pirates: AARRR! | Dave McLure talk
- Optimizing Retention: The Silent Killer and King of Growth | Brian Balfour talk at CXL Live 2016
- Why Retention is King of Growth Strategy | Brian Balfour talk at WMD Conference 2015
- Step-by-Step Guide to Understanding Retention Rate | WallStreetPrep
Boost your platform with
Watchers embedded tools for ultimate engagement


